Contents
Pie Charts in vf using Google Charts

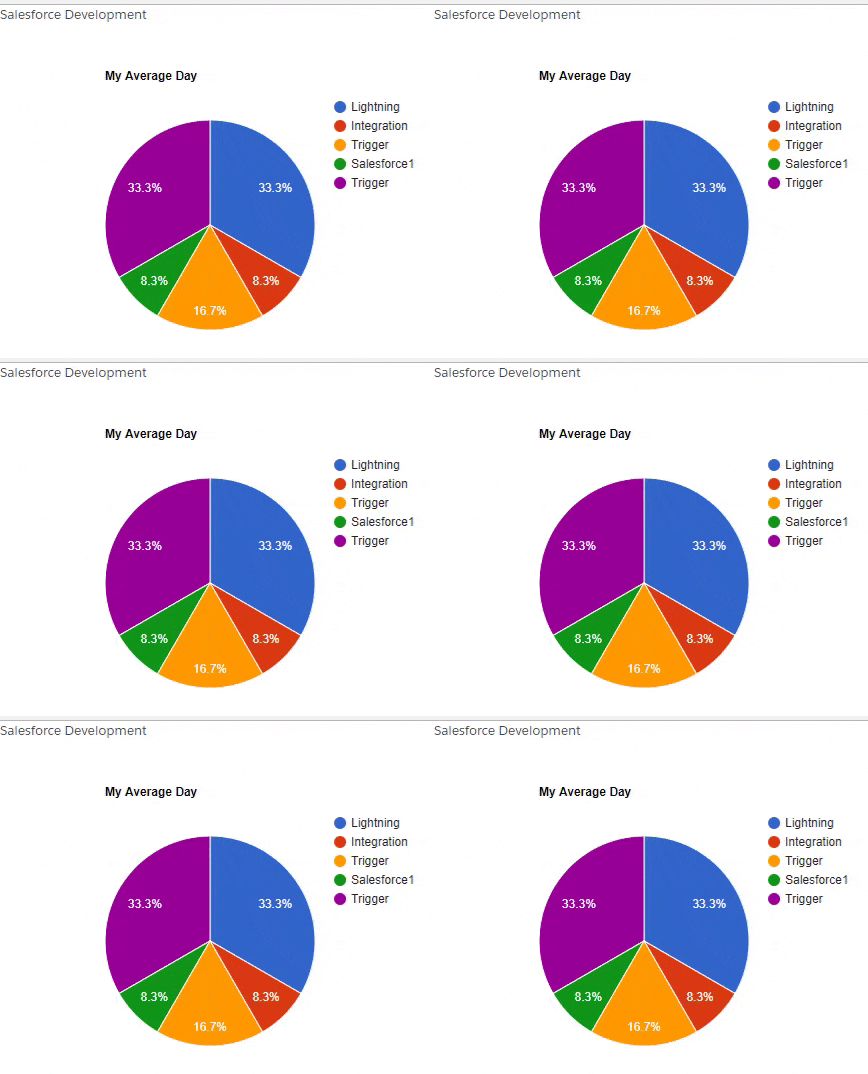
Today I have a requirement that we need to design the Pie Charts in vf using Google Charts. So I have designed code on work through the below code. We have designed using in visualforce page with SLDS functionality.
Code
<apex:page showHeader="false" sidebar="false" lightningStylesheets="true">
    <apex:slds />
    <h1>Salesforce Development</h1>
    <div id="piechart"></div>
    <script type="text/javascript" src="https://www.gstatic.com/charts/loader.js"></script>
    <script type="text/javascript">
    // Load google charts
    google.charts.load('current', {
    'packages': ['corechart']
    });
    google.charts.setOnLoadCallback(drawChart);

    // Draw the chart and set the chart values
    function drawChart() {
    var data = google.visualization.arrayToDataTable([
    ['Task', 'Hours per Day'],
    ['Lightning', 8],
    ['Integration', 2],
    ['Trigger', 4],
    ['Salesforce1', 2],
    ['Trigger', 8]
    ]);

    // Optional; add a title and set the width and height of the chart
    var options = {
    'title': 'My Average Day',
    'width': 550,
    'height': 400
    };

    // Display the chart inside the <div> element with id="piechart"
    var chart = new google.visualization.PieChart(document.getElementById('piechart'));
    chart.draw(data, options);
    }

    </script>
</apex:page>
Code Proceedings:
- Loader.js is used to design store javascript functionality to load functionality.
- Used Lightning Style sheets is equal to true to allow SLDS view in Visualforce page.
- Task and Hours per day are variables initialize in code.
- apex:slds to support SLDS in visualforce page
- Script tag contains java script code to run on click on checkbox to Display button.
Output:

Comment use if you face any problems while implementing
By following above method you can add Pie Charts in vf using Google Charts
learn more about the basics of lightning components


Add comment