In our previous blog post we had discussed about What is Reports in Salesforce. In these blog post we discuss about What is Dashboards in Salesforce
Contents
What is Dashboards in Salesforce
What is Dashboards in Salesforce
Salesforce is a powerhouse for businesses that need a robust platform to manage customer relationships, drive sales, and track key metrics. One of the essential features within Salesforce is its dashboard functionality. Dashboards make data visually accessible, letting users keep a pulse on key metrics with just a glance. But what exactly are Salesforce dashboards, and how can they revolutionize your business insights? Let’s dive in.
What Are Dashboards in Salesforce
In Salesforce, a dashboard is a visual representation of data. It pulls information from reports to provide real-time insights and key performance indicators (KPIs) in a simple, graphical format. Dashboards can be customized to display metrics relevant to each team, ensuring that everyone from sales reps to executives can track what matters most to them.
Key Components of a Salesforce Dashboard
Dashboards in Salesforce are made up of several components, each offering a unique way to present data:
- Charts: Visual representations like bar, line, and pie charts help users see trends and patterns at a glance.
- Tables: Tables display data in rows and columns, allowing for detailed views of metrics.
- Gauges: These are perfect for tracking metrics with numerical thresholds, like percentage to target.
- Metrics: Standalone numbers display essential information, such as total revenue or number of leads.
- Custom Links and Filters: Users can create links to other pages or apply filters for targeted data views.
Benefits of Using Dashboards in Salesforce
Using dashboards provides many benefits, including:
- Real-Time Insights: Dashboards pull live data, enabling up-to-the-minute updates on metrics.
- Improved Productivity: A well-designed dashboard minimizes time spent on data gathering.
- Enhanced Decision-Making: With instant access to key insights, teams can make data-driven decisions.
- Team Collaboration: Shared dashboards ensure everyone is on the same page, fostering alignment.
How Dashboards Help in Data Visualization
Data visualization is essential for interpreting complex data sets. Dashboards make data interpretation easier by converting raw numbers into visuals, like graphs or gauges, so users can identify trends, spot anomalies, and track changes over time. In essence, a dashboard makes your data more approachable and actionable.
Types of Dashboards in Salesforce
Salesforce offers various types of dashboards to meet different needs:
- Operational Dashboards: Track daily activities, like sales calls or customer inquiries.
- Analytical Dashboards: Focus on trends, patterns, and data over time.
- Strategic Dashboards: Ideal for executive-level monitoring of KPIs tied to long-term goals.
- Tactical Dashboards: Used by middle management to monitor processes and departmental goals.
Standard Dashboards vs. Custom Dashboards
- Standard Dashboards: Pre-built dashboards available in Salesforce. They offer essential insights but may lack customization.
- Custom Dashboards: Built from scratch, these dashboards allow users to tailor visuals to meet specific needs and preferences, providing greater flexibility and relevance.
How to Create a Dashboard in Salesforce
Creating a dashboard in Salesforce is simple:
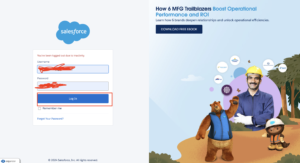
Login to Salesforce Account

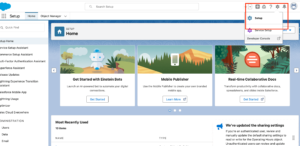
Click Gear icon Navigation to Setup

In app launcher Sales
Navigate to Dashboard
Create a New Dashboard

Create Reports

Choose Dashboard Type

Add Components

Arrange Layout

Understanding Salesforce Dashboard Builder
The Salesforce Dashboard Builder is a drag-and-drop tool that allows users to create dashboards without needing to code. With it, you can easily add and rearrange components, apply filters, and adjust settings to achieve the desired data visualization.
Dashboard Filters and Their Uses
Filters let users see specific segments of data within a dashboard, such as performance by region or department. This capability allows users to drill down into the details they need without cluttering the dashboard with separate components for each segment.
Best Practices for Building Effective Dashboards
To create an impactful dashboard:
- Keep It Simple: Avoid clutter by only including the most critical metrics.
- Use Relevant Visuals: Match data types to the right visuals (e.g., trends with line charts, comparisons with bar charts).
- Group Related Data: Group similar metrics to create a logical flow.
- Test User Experience: Ensure the dashboard layout is intuitive for all users.
- Regularly Update: Keep dashboards relevant by updating metrics as business needs change.
Sharing and Accessing Dashboards in Salesforce
Salesforce allows you to share dashboards with team members, ensuring they have access to real-time insights. Access permissions can be set to control who can view, edit, or manage each dashboard, keeping data secure and relevant for each role.
Common Use Cases for Salesforce Dashboards
Some common applications of Salesforce dashboards include:
- Sales Monitoring: Track sales targets, revenue, and pipeline progress.
- Customer Service: Monitor response times, case resolutions, and customer satisfaction.
- Marketing Campaigns: Measure campaign performance, lead generation, and ROI.
- Financial Reporting: Analyze revenue, expenses, and profitability.
Monitoring Performance with Dashboards
Dashboards provide an easy way to track performance metrics, helping users monitor progress toward goals and quickly identify areas needing improvement. This ensures that organizations stay proactive and adjust strategies based on real-time data.
Conclusion
Salesforce dashboards are powerful tools for data visualization, enabling users to transform complex data into actionable insights. By customizing and optimizing dashboards, businesses can drive productivity, foster collaboration, and make informed decisions that lead to success.
We want to more about What is Dashboards in salesforce Click Here
FAQs
What is a Salesforce dashboard used for?
Dashboards are used for real-time data visualization, enabling users to monitor KPIs and make data-driven decisions.
Can I customize my Salesforce dashboard?
Yes, Salesforce allows for extensive customization, so you can tailor dashboards to specific needs.
How often do Salesforce dashboards update?
Salesforce dashboards update in real-time, giving users access to the latest metrics.
What types of data can I visualize on a dashboard?
You can visualize sales data, customer service metrics, marketing analytics, and more.
Is it possible to share dashboards with team members?
Absolutely! You can set permissions for each dashboard to control who can view or edit them.
In our next blog post we will discuss about What is Dynamic Dashboard in Salesforce


Add comment